Showing posts with label Johnson and Johnson. Show all posts

Sunday 14 April 2024

Johnson & Johnson


Johnson & Johnson: Doubling Down On This 2024 Dog Of The Dow

Apr. 12, 2024


Summary

Johnson & Johnson (JNJ) is positioned to gain on the upside due to solid financials, consistent dividend streak, and potential increase in healthcare spending.

JNJ is included in the Dogs of the Dow list for 2024 and I plan to capitalize on the opportunity.

JNJ's financials show impressive growth in both the Innovative Medicine and MedTech segments. The FY24 outlook is strong with continued growth on the runway.

Running a dividend discount calculation gets us to a fair estimated stock price of $188.85 per share. This indicates a double digit upside.

The dividend has been increased for over 61 consecutive years. The current dividend yield is 3%, which sits above the 4 year average yield of 2.66%.


Overview

Johnson & Johnson (NYSE:JNJ) has always been one of those companies that has a product and service offering so wide and large that JNJ can be considered its own healthcare ETF. Johnson & Johnson operates within the healthcare space with focus on some of the following segments: immunology, infections, neuroscience, and oncology to name a few. In addition, they also operate a segment called MedTech, that provides interventional solutions. With solid financials, a consistent dividend streak, and perseverance within an industry that's been lackluster for some time now, I believe JNJ is more attractive than ever and the price is positioned to gain on the upside.


Chart

Data by YCharts

The real disconnect has from the Healthcare Sector (XLV) started back in the pandemic drop of 2020. Despite some ongoing headwinds, I believe we are set to see a very profitable future ahead of us with with interest rates eventually being cut and a large increase of healthcare spending throughout the US. I believe there is a current price connect and I am doubling my position after this recent price drop to the $150 per share level. This is because I think that JNJ is undervalued in terms of valuation. For instance, the current P/E ratio (price to earnings) sits at 17.36x, which sits below the 5 year average P/E as well as the sector median.

JNJ has already reported their Q4 earnings in January to close off their fiscal year 2023. They are set to report their upcoming Q1 earnings on the 16th of April so I will also cover some rough estimates of mine alongside what my future out look is for the company. The current dividend yield is slightly over 3% and JNJ is one of the most reliable dividend stocks in history. They have managed to increase the dividend for over 61 consecutive years, making JNJ a member of the elite Dividend Kings club. Lastly, I wanted to share something that's probably already known, but JNJ has made 2024's Dog's Of The Dow list so I look to take advantage of this opportunity as well.


Dog Of The Dow

The Dogs of the Dow strategy is something that is super simple to implement in practice. It focuses on selecting companies within the Dow Jones 30 index that has the highest current dividend yields. A higher yield in this blue chip context can be for a variety of reasons; maybe the fundamentals have weakened, the industry as a whole is suppressed, or the company is performing badly. Either way, making this list usually means that the price has fallen below its usual trading range.

Since price and dividend yield are inverse of one another, the drop in price causes the yield to spike to levels higher than the normal range. By using this strategy, I aim to capitalize on this elevated dividend yield as I believe the fundamentals of the company are strong enough to bring the price back to the highs. For context, here are the current Dogs Of The Dow:


Symbol Company Yield

(VZ) Verizon 6.51%

(MMM) 3M 5.45%

(WBA) Walgreens 5.21%

(DOW) Dow 4.68%

(CVX) Chevron 4.02%

(IBM) IBM 3.51%

(AMGN) Amgen 3.33%

(KO) Coca-Cola 3.25%

(CSCO) Cisco 3.20%

(JNJ) Johnson & Johnson 3.13%

Like I said, companies can make this list because of their recent poor performance in the short term. For example, Walgreen (WBA) has struggled to continue growing sales for an extending period of time. As a result the share price collapse by approximately -50% over the last 1 year period. Even with a recent dividend cut of -48%, the yield is still inflated to over 5.2%. The same story here for 3M (MMM) has caused the price to struggle for an extending period of time; lower growth metrics, slump in meaningful growth prospects, and a decreasing level of free cash flow. As a result MMM's dividend yield is historically high at 5.4%.

However, some companies make the list due to factors outside of their control. For example, Dow (DOW) has struggled to gain any meaningful momentum due to a combination of higher interest rates, poor macro environment for their industry, and lower profit margins outside of their control. However, they have strategically and efficiently managed their cash to navigate these rough times. As a result, they have a great future ahead once pricing and margins become more attractive. I wrote all about it in depth in my previous article titled: 'Dow: Q4 Earnings Reinforce Great Cash Management For This Stock'.

I wanted to highlight this strategy because it has seen impressive results in recent history. We can see how the Dogs outperform the S&P 500 in return for 4 out of the 5 years listed. Similarly, the Dogs outperform the Dow Jones for 3 out of 5 years listed. While its by no means a perfect strategy, it does offer a bit of a defensive stance as the Dogs typically held up better during down years.


Dogs Of The Dow performance comparison


Dogs Of The Dow


Financials

JNJ operates in two main segments: Innovative Medicine sales & Worldwide MedTech sales. Both of these segments have seen impressive growth metrics with the Innovative medicine segment growing sales by 9.5% for 2023, excluding Covid-19 vaccine related sales. Similarly, the MedTech segment experienced a 9.1%% operational sales growth. Growth in these segments can be attributed to increases in surgery, orthopedics, interventional solutions, and vision.

JNJ reported their Q4 earnings in January to close of their fiscal 2023 figures. As a result we can see that growth was achieved worldwide. JNJ closed off 2022 with $80B in sales worldwide and this has now increased to $85.2B. The only region that experienced a decline was the European market but even then, it was slight a slight decrease from $20.7B to $20.4B which is negligible. Reported sales great by 6.5% to close the year.


JNJ full year sales 2023


Q4 JNJ Presentation

Adjusted earnings per share [EPS] for the full year also saw impressive growth of 11.1%, increasing from $8.93 at the close of last year up to $9.92. Between the two segments, Medtech is where the most impressive growth has taken place. The segment has operational growth of 13.4% for Q4 with Interventional Solutions growing by a whopping 52.3% due to new products such as QDOT and OCTARAY having success in the markets they launched within. The other segment, Innovative Medicine, also saw growth of 4% for the quarter. In this segment there was a large decrease in profits from the infectious disease category but this is completely understandable since this mainly consisted of Covid-related revenue.


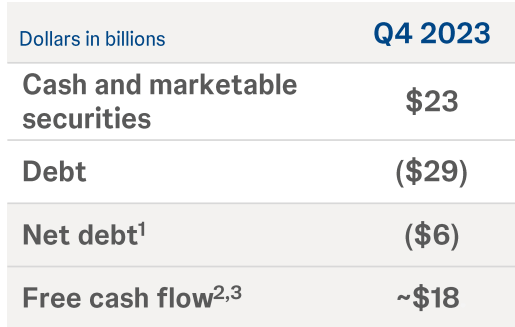
JNJ capital allocation strategy

Q4 JNJ Presentation

The financial picture here supports the fact that management cares about using capital is the most efficient way possible. They closed out Q4 with a free cash flow of $18B and have successfully used their capital management skills to continue pouring cash back into the business. Cash and marketable securities total $23B while debts total $29B.

Their capital allocation strategy first prioritizes the organic growth needs of different channels within the business. As a result of this, they continue to grow FCF. This FCF can then be used to either invest, growth, research, or develop other areas of their business. Or it can be used to further increase dividend payments and initiate share repurchases.

JNJ closed out their 2023 with over $15B invested into research and development. Over the course of last year they also completed $2.5B worth of share repurchases while paying out a total of $11.8B in dividends to shareholders. This is a company that knows how to handle their cash.


Valuation & Outlook

In terms of valuation, I think that we have a great opportunity for entry at this level. The average Wall St. price target sits at $175.36 per share. This represents a potential upside of 16.75%. I feel highly confident that we are capable of surpassing this price target based on the growth experienced across segments as well as some following valuation metrics. The current P/E ratio sits at 17.36x compared against the sector median P/E of 26.34c. In addition, the 5 year average P/E of JNJ is 20.87x. In addition, the current Price to Book ratio is 4.68 compared to the 5 year P/B ratio of 5.61x.

According to management, adjusted operational sales are estimated to grow at a rate between 5 - 6%. Reported sales are estimated to grow between 4.5% - 5.5% while earnings per share are estimated to grow between 6.4 - 8.4%. Seeing the recent growth delivered over the course of 2023, I think these are highly realistic and likely numbers tat will be achieved. Therefore, I think it would be appropriate to run my own dividend growth model to get another estimated fair stock price.

First, I started by compiling all of the annual dividend payouts for the last few years. Next, I used the estimated annual payout of $4.91 per share for 2024 and inserted it into the calculation. We can see that the dividend has grown at an average of 5.61% per year since 2018. Earnings are expected to grow between 6.4 - 8.4% so I decided to go with a middle of the road input of 7.4% EPS growth. As a result, I determine a fair stock price of $188.85%. This would represent a large potential price upside of approximately 25.7%.


Dividend Discount Calculation

Author Created

Earnings for the full year of 2023 amounted to $10.43/share. Since the growth estimates for each segment are strong, I anticipated a bump in earnings for the full year of 2024. JNJ is set to report their Q1 2024 earnings reported on April 16th. To get a rough estimate, I compiled all of the EPS metrics reported since Q1 of 2019. I took every year's EPS report and calculated out an average EPS growth of 15.74% per year. While this is abnormally strong, I wanted to remain more conservative in my estimate so I want to slice number in half.


Dividend

JNJ has been able to grow their dividend payments for over 61 consecutive years. This puts them in an elite class of dividend kings! As a result they've earned the respect of dividend investors since the income has been so consistent for so any decades. As of the latest declared quarterly dividend of $1.19 per share, the current starting dividend yield is slightly over 3%. For reference, the average dividend yield over the last four years has been 2.66% so you'd be getting a higher yield than normal. The dividend remains well covered with a healthy payout ratio of only 45%. For reference, the average payout ratio of the last 5 years is also 45%. JNJ has about $22.8B in cash from operations to cover any potential headwinds or lack of growth.


Chart

Data by YCharts

We can see how the dividend has grown by 70% over the last decade. Over this time period, this growth equates to a CAGR (compound annual growth rate) of 6.07% over the last ten years. Over a smaller time horizon of 5 years, the dividend has increased at a CAGR of 5.75%. While the yield is only 3%, a larger rate of growth would be more ideal. However, I am thankful that JNJ has not increased the dividend too much since the pandemic because it means they have more cash on hand to ride out the subpar performance of the entire sector and invest in further growth initiatives, acquisitions, and research. For example, JNJ is to acquire Shockwave Medical (SWAV) for $13.1B. Continued moves like this are ways to continue boosting profitability.

The income growth aspect of JNJ truly makes this such a great choice for dividend growth investors. Using Portfolio Visualizer, we can see the growth of income from an original investment of $10,000. This chart assumes that no additional capital was deployed and only dividends were reinvested. Your dividend income would have started out as $300 in 2014 and you'd now be receiving over $661 annually in 2024. Now imagine if you dollar cost averaged into JNJ a few times a year? Your income would grow substantially faster!

JNJ dividend income growth

Portfolio Visualizer


Risk

While I believe strong in my thesis that JNJ is undervalued, there are some risks and factors to consider. With the release of the March CPI Report, the chances of interest rate cuts are less likely. The probability that the federal funds rate will stay the same is now 73.2%. Higher inflation levels can impact consumer spending and reduce all around segment sales and profitability for JNJ. In addition, a higher federal funds rate can mean higher interest payments on debt obligations, although JNJ is currently AAA rated this is less of a worry.

Most important, JNJ has been plagued with ongoing fines and lawsuits. While this has almost always been the case for the company, large lawsuits and settlements chew into profitability. Cough syrup was recently recalled in Nigeria over toxicity concerns. Although early in the process, who knows how far these things can go. Sometime it seems like the abundance of negative news over powers the financials of the company. For example, JNJ may have to pay $700M to settle a talcum powder lawsuit due to marketing this controversial product. In addition, there is also a baby powder suit for $75M that JNJ has to settle with the state of Mississippi. However, $75M is essentially immaterial for JNJ so this is a win.


Takeaway

Johnson & Johnson (JNJ) has had their stock price beaten up for the better part of a year. While the entire healthcare sector has also lacked growth to keep up with the S&P 500 (SPY), I believe this to present a great opportunity to initiate a position or add more shares at these price levels. From a valuation perspective, the stock remains cheap with an average Wall St. target of $175 per share and my own personal dividend discount calculated estimate fair value of $188.85 per share. This presents an opportunity for appreciation anywhere between 16 - 25% after the recent price drop. This becomes even more attractive when you consider that you will also be collecting one of the most reliable dividend streams out there, with a current dividend yield of 3%.

I feel that JNJ has a lot of strong indicators aligned at the moment. Under valuation, a strong dividend, excellent revenue growth across segments, and a current Dog of the Dow. The Dog of the Dow strategy is by no means failproof, but it has historically offered greater downside protection and potential to outperform the greater indexes. On going lawsuits and settlements may disrupt the price movement in the short term, but the fundamentals are strong so I believe will succeed and provide long term growth. As a result, I rate shares of JNJ as a Strong Buy.

https://seekingalpha.com/article/4683388-johnson-and-johnson-doubling-down-on-this-2024-dog-of-the-dow-jnj-stock


Saturday 13 April 2024

Unlocking Q1 Potential of Johnson & Johnson (JNJ)

Unlocking Q1 Potential of Johnson & Johnson (JNJ): Exploring Wall Street Estimates for Key Metrics

Zacks Equity Research

Thu, 11 April 2024 


Analysts on Wall Street project that Johnson & Johnson (JNJ) will announce quarterly earnings of $2.64 per share in its forthcoming report, representing a decline of 1.5% year over year. Revenues are projected to reach $21.38 billion, declining 13.6% from the same quarter last year.

The consensus EPS estimate for the quarter has been revised 0.1% higher over the last 30 days to the current level. This reflects how the analysts covering the stock have collectively reevaluated their initial estimates during this timeframe.

Prior to a company's earnings announcement, it is crucial to consider revisions to earnings estimates. This serves as a significant indicator for predicting potential investor actions regarding the stock. Empirical research has consistently demonstrated a robust correlation between trends in earnings estimate revision and the short-term price performance of a stock.

While investors typically use consensus earnings and revenue estimates as a yardstick to evaluate the company's quarterly performance, scrutinizing analysts' projections for some of the company's key metrics can offer a more comprehensive perspective.


In light of this perspective, let's dive into the average estimates of certain Johnson & Johnson metrics that are commonly tracked and forecasted by Wall Street analysts.

It is projected by analysts that the 'Sales- MedTech- Total' will reach $7.93 billion. The estimate indicates a change of +5.9% from the prior-year quarter.

The average prediction of analysts places 'Sales- Innovative Medicine- WW' at $13.44 billion. The estimate suggests a change of +0.2% year over year.

According to the collective judgment of analysts, 'Sales- MedTech- Orthopaedics- Trauma- WW' should come in at $778.57 million. The estimate indicates a year-over-year change of +2.9%.

The collective assessment of analysts points to an estimated 'Sales- MedTech- Orthopaedics- Spine, Sports & Other- WW' of $736.53 million. The estimate suggests a change of +1% year over year.

The combined assessment of analysts suggests that 'Sales- MedTech- Orthopaedics- Hips- US' will likely reach $250.20 million. The estimate points to a change of +3.8% from the year-ago quarter.

Analysts expect 'Sales- MedTech- Orthopaedics- Hips- International' to come in at $148.34 million. The estimate indicates a change of -0.4% from the prior-year quarter.

The consensus among analysts is that 'Sales- MedTech- Orthopaedics- Knees- US' will reach $232.66 million. The estimate suggests a change of +3% year over year.

Analysts predict that the 'Sales- MedTech- Orthopaedics- Knees- International' will reach $146.04 million. The estimate indicates a change of +2.9% from the prior-year quarter.

Based on the collective assessment of analysts, 'Sales- MedTech- Orthopaedics- Trauma- US' should arrive at $500.35 million. The estimate indicates a change of +1.9% from the prior-year quarter.

The consensus estimate for 'Sales- MedTech- Orthopaedics- Trauma- International' stands at $278.12 million. The estimate indicates a year-over-year change of +4.2%.

Analysts' assessment points toward 'Sales- MedTech- Orthopaedics- Spine, Sports & Other- US' reaching $408.28 million. The estimate indicates a change of +0.6% from the prior-year quarter.

Analysts forecast 'Organic Sales Growth (Operational growth)' to reach 3.9%. Compared to the present estimate, the company reported 9% in the same quarter last year.


https://uk.finance.yahoo.com/news/unlocking-q1-potential-johnson-johnson-131516612.html?guccounter=1&guce_referrer=aHR0cHM6Ly93ZWIudGVsZWdyYW0ub3JnLw&guce_referrer_sig=AQAAAK_nMhZAe1ribDUlfq7jNLCGzhB6rKvlsS-KUUOj82rcWngephRqtPzRgmC2TVD0-pj5s6nIN8FCN8INkv3fJh20Fhdbhs4os3074-LFaafLgetXTx-c62-WAZcenyJlWHf_LjPLLa1uHQg-KPdTlKkM7UnRxMBKVFkDHRSLAAE3

Tuesday 5 March 2024

Is There An Opportunity With Johnson & Johnson's (NYSE:JNJ) 41% Undervaluation?

Comment:   

An example of using 2 stage growth model and discount cash flow method in valuing a company.

The discount cash flow method is based on 2 assumptions:   future cash flows and the applied discount rate.  

It is not an exact science.  One should you conservative assumptions in your valuation.

Charlie Munger mentioned that he had never seen Warren Buffett using the DCF method in his valuation.   There are better and easier ways to value a company.  Often you will know if a company is cheap or very expensive, even without having to do elaborate studies.   (An analogy is you do not need to know the weight to know that this person is overweight or obese or underweight.)  

Keep your valuation simple.  It is better to be approximately right than to be exactly wrong.

The article below shares how to do valuation in detail.

Happy investing.  


Key Insights

  • Using the 2 Stage Free Cash Flow to Equity, Johnson & Johnson fair value estimate is US$275

  • Johnson & Johnson is estimated to be 41% undervalued based on current share price of US$162

  • Analyst price target for JNJ is US$174 which is 37% below our fair value estimate

Does the March share price for Johnson & Johnson (NYSE:JNJ) reflect what it's really worth? Today, we will estimate the stock's intrinsic value by taking the forecast future cash flows of the company and discounting them back to today's value. We will use the Discounted Cash Flow (DCF) model on this occasion. There's really not all that much to it, even though it might appear quite complex.

We generally believe that a company's value is the present value of all of the cash it will generate in the future. However, a DCF is just one valuation metric among many, and it is not without flaws. If you want to learn more about discounted cash flow, the rationale behind this calculation can be read in detail in the Simply Wall St analysis model.

Check out our latest analysis for Johnson & Johnson

What's The Estimated Valuation?

We're using the 2-stage growth model, which simply means we take in account two stages of company's growth. In the initial period the company may have a higher growth rate and the second stage is usually assumed to have a stable growth rate. To start off with, we need to estimate the next ten years of cash flows. Where possible we use analyst estimates, but when these aren't available we extrapolate the previous free cash flow (FCF) from the last estimate or reported value. We assume companies with shrinking free cash flow will slow their rate of shrinkage, and that companies with growing free cash flow will see their growth rate slow, over this period. We do this to reflect that growth tends to slow more in the early years than it does in later years.

A DCF is all about the idea that a dollar in the future is less valuable than a dollar today, so we discount the value of these future cash flows to their estimated value in today's dollars:

10-year free cash flow (FCF) estimate

2024

2025

2026

2027

2028

2029

2030

2031

2032

2033

Levered FCF ($, Millions)

US$22.8b

US$23.9b

US$24.5b

US$25.0b

US$26.4b

US$27.2b

US$28.0b

US$28.7b

US$29.4b

US$30.2b

Growth Rate Estimate Source

Analyst x5

Analyst x6

Analyst x5

Analyst x3

Analyst x3

Est @ 2.99%

Est @ 2.78%

Est @ 2.63%

Est @ 2.53%

Est @ 2.46%

Present Value ($, Millions) Discounted @ 6.0%

US$21.5k

US$21.3k

US$20.6k

US$19.9k

US$19.8k

US$19.2k

US$18.6k

US$18.1k

US$17.5k

US$16.9k

("Est" = FCF growth rate estimated by Simply Wall St)
Present Value of 10-year Cash Flow (PVCF) = US$193b

We now need to calculate the Terminal Value, which accounts for all the future cash flows after this ten year period. For a number of reasons a very conservative growth rate is used that cannot exceed that of a country's GDP growth. In this case we have used the 5-year average of the 10-year government bond yield (2.3%) to estimate future growth. In the same way as with the 10-year 'growth' period, we discount future cash flows to today's value, using a cost of equity of 6.0%.

Terminal Value (TV)= FCF2033 × (1 + g) ÷ (r – g) = US$30b× (1 + 2.3%) ÷ (6.0%– 2.3%) = US$838b

Present Value of Terminal Value (PVTV)= TV / (1 + r)10= US$838b÷ ( 1 + 6.0%)10= US$469b

The total value, or equity value, is then the sum of the present value of the future cash flows, which in this case is US$663b. To get the intrinsic value per share, we divide this by the total number of shares outstanding. Relative to the current share price of US$162, the company appears quite good value at a 41% discount to where the stock price trades currently. The assumptions in any calculation have a big impact on the valuation, so it is better to view this as a rough estimate, not precise down to the last cent.

dcf
dcf

The Assumptions

The calculation above is very dependent on two assumptions. The first is the discount rate and the other is the cash flows. If you don't agree with these result, have a go at the calculation yourself and play with the assumptions. The DCF also does not consider the possible cyclicality of an industry, or a company's future capital requirements, so it does not give a full picture of a company's potential performance. Given that we are looking at Johnson & Johnson as potential shareholders, the cost of equity is used as the discount rate, rather than the cost of capital (or weighted average cost of capital, WACC) which accounts for debt. In this calculation we've used 6.0%, which is based on a levered beta of 0.800. Beta is a measure of a stock's volatility, compared to the market as a whole. We get our beta from the industry average beta of globally comparable companies, with an imposed limit between 0.8 and 2.0, which is a reasonable range for a stable business.

SWOT Analysis for Johnson & Johnson

Strength

  • Debt is not viewed as a risk.

  • Dividends are covered by earnings and cash flows.

Weakness

  • Earnings declined over the past year.

  • Dividend is low compared to the top 25% of dividend payers in the Pharmaceuticals market.

Opportunity

  • Annual earnings are forecast to grow for the next 3 years.

  • Good value based on P/E ratio and estimated fair value.

Threat

  • Annual earnings are forecast to grow slower than the American market.

Next Steps:

Valuation is only one side of the coin in terms of building your investment thesis, and it shouldn't be the only metric you look at when researching a company. The DCF model is not a perfect stock valuation tool. Preferably you'd apply different cases and assumptions and see how they would impact the company's valuation. For instance, if the terminal value growth rate is adjusted slightly, it can dramatically alter the overall result. What is the reason for the share price sitting below the intrinsic value? For Johnson & Johnson, there are three pertinent aspects you should consider:

  1. Risks: Every company has them, and we've spotted 1 warning sign for Johnson & Johnson you should know about.

  2. Future Earnings: How does JNJ's growth rate compare to its peers and the wider market? Dig deeper into the analyst consensus number for the upcoming years by interacting with our free analyst growth expectation chart.

  3. Other Solid Businesses: Low debt, high returns on equity and good past performance are fundamental to a strong business. Why not explore our interactive list of stocks with solid business fundamentals to see if there are other companies you may not have considered!

PS. The Simply Wall St app conducts a discounted cash flow valuation for every stock on the NYSE every day. If you want to find the calculation for other stocks just search here.


 editorial-team@simplywallst.com (Simply Wall St)

https://uk.finance.yahoo.com/news/opportunity-johnson-johnsons-nyse-jnj-110049724.html

Friday 29 September 2023

JOHNSON & JOHNSON


Revenues increased from US 71.3 B in 2013 to US 94.9 B in 2022.

PBT increased from  US15.5 B in 2013 to US 21,7 B in 2022.

EPS increased from US 4,81 in 2013 to US 6.73 in 2022.

PBT margin averages 23.77% from 2013 to 2022.


Quality:  Great (Stalwart, Slow grower)

Management:  Excellent

Valuation: -

Those holding this stock has enjoyed gradual increasing dividends for many years.  An example of a dividend growth investing stock.  


Mkt cap
377.77B
P/E ratio
31.79
Div yield
3.03%
CDP score
A
52-wk high
181.04
52-wk low
150.11

At USD 156.88 per share, it is trading at the lower half of its 52-wk high and low price range, giving a DY of 3.03%.  

My projection is this company will continue to grow its annual EPS at just below 5% per year consistently.

Wednesday 16 December 2015

Johnson & Johnson

Johnson & Johnson
JNJ (NYSE)
Website: www.jnj.com

Sector:  Health Care
Beta Coefficient: 0.5
10 Yr Compound EPS Growth:  8.5%
10 Yr Compound DPS Growth: 11.5%
Dividend raises, past 10 years: 10 times.


Financial Result Year 2014

Revenues (m)     74,311
Net Income (m)   17,105
EPS  5.97
DPS 2.76
Cash flow per share 7.90
Current yield 2.8%

High Price  106.5  P/E 17.8    DY 2.59%
Low Price     96.1  P/E 16.1    DY 2.87%


The company has three reporting segments:
Consumer Health Care ($145 billion in FY2014 sales)
Medical Devices and Diagnostics ($27.5 billion), and 
Pharmaceuticals ($32.3 billion).

J&J has more than 250 operating companies in 60 countries, selling some 50,000 products in more than 175 countries.

The company is fairly active with acquisitions, acquiring small niche players to strengthen its overall product offering.

J&J continues to own a dominant and stable franchise in a secure and lucrative industry.

Persistent and moderate share buybacks and dividend increases gave shareholders their fair share of the profitability of its business.

The company expects to resume a mid-single digits growth pace for both revenues and earnings in FY 2016, with corresponding benefits paid to shareholders.

J&J's steady earnings and cash flow combined with a healthy dividend and share repurchases provide gratifying total shareholder returns.

The P/E has expanded from 14 - 15 to the 16 - 17 range, adding a bit of downside risk.


Stock Performance Chart for Johnson & Johnson


Saturday 7 July 2012

5 Companies You Can Buy Today

By Morgan Housel
July 6, 2012

There are many ways to value a company. Price to earnings. Price to cash flow. Liquidation value. Price per eyeballs on website. Price to a number I made up (this one never gets old). Price to CEO's ego divided by lobbying activity as a percentage of revenue (this one doesn't get used enough).
Which one is best? They're all limited and reliant on assumptions. No single metric holds everything you need to know.
The metric I'm using today is no different. But it's perhaps the most encompassing, and least susceptible to hidden complexities of a company's financial statements. The more I think about it, the more I feel it's one of the most useful metrics out there.
What is it? Enterprise value over unlevered free cash flow.                                                       
  • Enterprise value is market capitalization (share price times shares outstanding) plus total debt and minority interests, minus cash.
  • Unlevered cash flow is free cash flow with interest paid on outstanding debt added back in.
The ratio of these two statistics provides a valuation metric that takes into consideration allproviders of capital -- both stockholders and bondholders.
But you invest in common stock, so why should you care about bondholders? Ask Lehman Brothers investors why. When a company earns money, it has to take care of bondholders before you, the common shareholder, get a dime. Focusing solely on profits and equity can be misleading.
Enterprise value provides a more encompassing view. By bringing debt capital into the situation, we see real earnings in relation to the company's entire capital structure. If you owned the entire business, this is the metric you'd naturally gravitate toward.
Using this metric, here are five companies I found that look attractive.
Company
Enterprise Value/Unlevered FCF
5-Year Average

CAPS Rating (out of 5)
Google (Nasdaq: GOOG  )18.135.2****
Johnson & Johnson(NYSE: JNJ  )19.821.9*****
Procter & Gamble (NYSE:PG  )24.628.4*****
UnitedHealth Group(NYSE: UNH  )6.910.2*****
Colgate-Palmolive (NYSE:CL  )22.824.4*****
Source: S&P Capital IQ.
Let's say a few words about these companies.
Three years ago, Warren Buffett and Charlie Munger had some flattering words for Google. "Google has a huge new moat. In fact I've probably never seen such a wide moat." Munger said. "I don't know how to take it away from them," Buffett said. "Their moat is filled with sharks!" Munger added.
Here's a good example: After trying to make inroads in the online ad business, Microsoft just wrote down almost the entire value of its 2007 purchase of aQuantive. The Daily Beast summed it up well: "Microsoft's $6.2 Billion Writedown Shows It's Losing War With Google."
I still like Microsoft because it's good at what it does. But advertising and search isn't it. That's Google's turf. And today you can buy Google at literally the lowest price-to-cash-flow ratio ever. Take advantage of that while it lasts.
Johnson & Johnson is one of the best-performing stocks over the last several decades. But it's having a rough go of it lately. Recalls, management blunders, more recalls, competition from generics... and on and on. Yes, growth has slowed. Yes, it might stay slow for a while. But valuation more than compensates for that. The stock currently provides a 3.6% dividend yield, and trades for 12 times next year's earnings -- below the market average. It's a good company at a good price.
Procter & Gamble is a similar story. One of the world's greatest collections of brands has hit a slowdown. That's hit shareholder returns -- P&G shares haven't budged in two years. But most of the company's missteps appear to be tied to poor execution by management. My guess: Within a year or two the company will have a new CEO, and the market will come to appreciate its value anew.
Everything important you need to know about UnitedHealth Group comes down to the Affordable Care Act, also known as Obamacare. Most health insurance companies currently trade at depressed valuations, likely because the market hates uncertainty -- something that still exists even after the Supreme Court ruled Obamacare constitutional.
But what are the two most likely outcomes here? One is that Obamacare remains law, in which case insurers will face a raft of costly new rules, but also a flood of new customers essentially mandated to buy their product. The other is that Obamacare is repealed -- likely under a Romney administration -- in which case those costly new rules would go away. Neither outcome seems particularly bad for insurers.
Past performance is no guarantee of future returns, but I can't help but point out how successful Colgate-Palmolive has been over the last 30 years. The toothpaste and soap company has produced average returns of nearly 17% a year since 1980, compared with 11% for the broader market. That's the power of two forces: A strong brand, and simple products that aren't pushed to extinction by new technology. Combine that with a pretty reasonable valuation, and Colgate-Palmolive should be a great company to own for years to come.

Wednesday 28 July 2010

A look at a great dividend growth company JNJ

APRIL 06, 2010


http://ab.typepad.com/ab_analytical_services/2010/04/jnj-dividend-hike-could-be-substantial.html